When looked at over long periods, Wall Street is a bona fide wealth creator. But when examined over the span of months or a few years, the stock market can be quite unpredictable.
Since the start of 2021, the iconic Dow Jones Industrial Average (DJINDICES: ^DJI), broad-based S&P 500 (SNPINDEX: ^GSPC), and growth-powered Nasdaq Composite (NASDAQINDEX: ^IXIC) catapulted to new highs, plummeted into a bear market, and have now bounced back meaningfully from their respective bear market lows set last year.
The prevailing question is, what’s next for stocks? According to one leading economic indicator that’s never been wrong, there’s a clear-cut answer.
Also Read– Uber’s stock deemed ‘hard to ignore’ with possible S&P 500 inclusion ahead

This leading indicator hasn’t been wrong in 64 years
To preface this discussion, there’s no such thing as a foolproof indicator or metric. If there was a surefire way to know the directional movements of stocks in advance, you can rest assured that every Wall Street professional and investor would be using it by now.
With that being said, there are a multitude of economic data points, probability tools, and leading indicators that have an uncanny ability to predict directional movements in the Dow, S&P 500, and Nasdaq Composite. Today, we’ll take a closer look at one that has a better track record than most: The Conference Board Leading Economic Index (LEI).
Read More:- A Bear Market Ahead? Insiders Are Waving a Red Flag.
The monthly reported LEI is a predictive tool composed of 10 inputs that are designed to recognize “turning points in the business cycle by around seven months,” according to The Conference Board. These 10 inputs include financial components, such as the interest-rate spread (i.e., the difference in yield) between 10-year Treasury bonds less the federal funds rate, as well as non-financial factors, such as private housing building permits and average weekly initial unemployment insurance claims.
Last week, on July 20, The Conference Board published the June LEI data, which showed a 15th consecutive month of declines. On an absolute basis, it represents the third-longest streak of consecutive monthly declines in the index.
Read More:– Tesla, Netflix drag down S&P 500, Nasdaq
More importantly, the LEI clocked in with a 4.2% decline over the six-month period between December 2022 and June 2023, which was a steeper drop than the 3.8% contraction experienced between June 2022 and December 2022. On an annual basis, the LEI is nearing a decline of close to 8%.
When back-tested to 1959, an annual contraction in the LEI of 4% has always represented that a definite recession will come for the U.S. economy. While modest contractions of 0.1% to 3.9% have occurred in the past where no recession has materialized, an annual contraction rate of 4% or greater has always eventually led to a U.S. recession.
Read More:-Overheated Market? Fidelity’s Jurrien Timmer Believes It’s ‘Almost’ In A New Bull Run
Justyna Zabinska-La Monica, Senior Manager, Business Cycles Indicators for the economics department at The Conference Board, notes, “We forecast that the U.S. economy is likely to be in a recession from Q3 2023 to Q1 2024.”
The reason this is meaningful is that stocks have a history of performing poorly immediately following the official start of a U.S. recession. The LEI hasn’t been wrong one time in 64 years, so once the 4% annual contraction threshold is crossed, it signals that stocks are more than likely going to head lower.
Other recession tools are sounding a warning
However, The Conference Board LEI isn’t an outlier. Rather, it’s one of a number of predictive tools currently forecasting economic weakness in the not-too-distant future.
Also Read– Samsung Galaxy Unpacked 2023: What to expect at today’s big launch

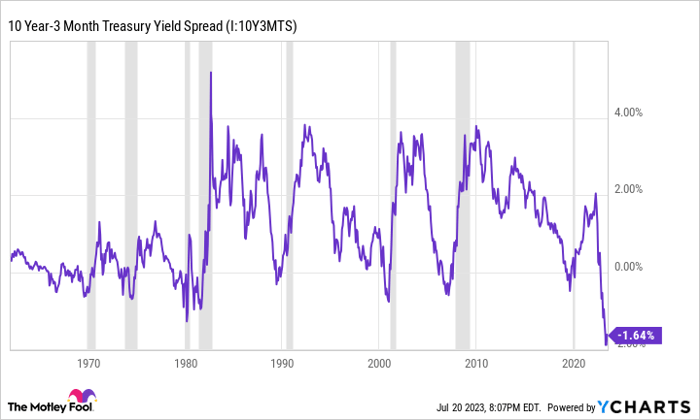
For instance, the Federal Reserve Bank of New York’s recession-probability indicator, which is calculated by measuring the spread between three-month and 10-year U.S. Treasury bonds, has been loudly warning of a recession for months.
When the U.S. economy is healthy, the Treasury yield curve slopes up and to the right. This is to say that longer-dated maturing bonds have notably higher yields than those set to mature in the short term. Ideally, the longer your money is tied up, the more you should be compensated for it.
Currently, the three-month/10-year Treasury spread is the most inverted it’s been in more than 40 years. A yield-curve inversion is where short-term notes have higher yields than long-term bonds. It’s typically a sign that investors believe economic weakness is on the horizon. Accordingly, the NY Fed’s predictive tool believes there’s a 67.31% chance of a U.S. recession taking place by June 2024.

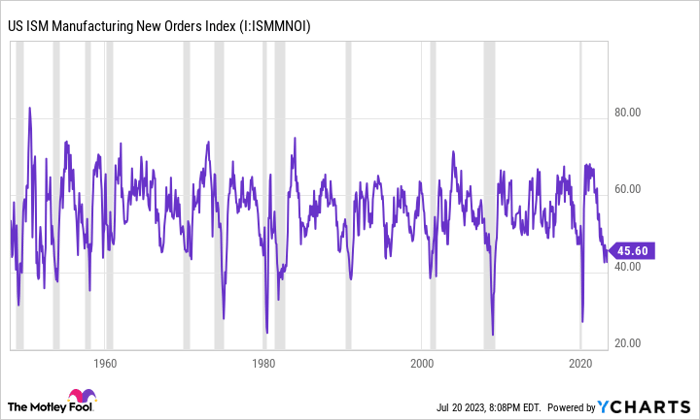
The ISM Manufacturing New Orders Index is yet another economic tool that appears to be signaling trouble to come for the U.S. economy. This index measures new industrial order activity and is reported monthly.
The ISM Manufacturing New Orders Index is measured on a scale of 0 to 100, with 50 representing the neutral baseline where new industrial orders are neither expanding nor contracting. A figure above 50 implies order expansion, while a reading below 50 would denote contraction. The past 10 readings for the ISM Manufacturing New Orders Index have been below 50.
What’s even more noteworthy is that two readings this year have been below 43.5. Over the last 70 years, the U.S. economy has always, eventually, fallen into a recession when readings were observed below 43.5.
Also Read- Samsung Phones’ Moon Photos Might Be Too Good to Be True
Predictive indicators can’t hold a candle to more than a century of flawless performance
While these predictive tools are pretty clear that the Dow Jones, S&P 500, and Nasdaq Composite are expected to move lower, there’s another reliable dataset that long-term investors can lean on. Every year, market research company Crestmont Research updates its dataset that takes a closer look at what a hypothetical investor would have generated in annualized total returns, including dividends, if they’d purchased an S&P 500 tracking index and (here’s the key point) held that position for 20 years.

What’s interesting about Crestmont’s analysis is that it was able to backtest its rolling 20-year return data to the start of the 20th century. While it’s true that the S&P didn’t exist until 1923 and didn’t hold 500 components until 1957, many of the same companies could be found in similar major indexes. This allowed Crestmont to accurately backtest its study to 1900, which yielded 104 ending years’ worth of rolling 20-year return data (1919-2022).
Read More:- How to directly sync Apple Watch workouts to Strava
How’s this for reliable: All 104 rolling 20-year periods produced a positive total return. To put this in a different light, it literally wouldn’t have mattered if you purchased an S&P 500 tracking index when it was near a peak or a trough since 1900. The only parameter of importance has been the willingness of investors to trust the process and remain invested for the long run.
While The Conference Board LEI, the NY Fed’s recession probability tool, and the ISM Manufacturing New Orders Index all offer ominous signs for the U.S. economy and Wall Street over the coming months, history conclusively shows there’s absolutely no reason to bet against America — including the Dow Jones Industrial Average, S&P 500, and Nasdaq Composite — if you’re an investor with a long-term mindset.


