Though you probably don’t need the reminder, 2022 was a miserable year for Wall Street and investors. Last year, the iconic Dow Jones Industrial Average (DJINDICES: ^DJI), benchmark S&P 500 (SNPINDEX: ^GSPC), and growth-stock-dependent Nasdaq Composite (NASDAQINDEX: ^IXIC) plunged 9%, 19%, and 33%, respectively. More importantly, all three indexes firmly fell into a bear market.
Read More:-Bank of America’s Subramanian says S&P 500 earnings risk a 10% drop in 2023
While bear market declines are a normal part of the investing cycle, they nonetheless leave most investors wondering when the light at the end of the tunnel will be reached. Although there’s no exact science to predicting when a bear market will end, history does provide two pretty clear clues as to how long bear markets last.
The average bear market takes more than a year to reach its nadir
Since the beginning of 1950, the widely followed S&P 500 has endured 39 separate double-digit percentage corrections. All told, 11 of these 39 declines have officially become bear markets. I say “officially” because I’m not including the 19.9% peak decline in 1990 or the 19.8% drop in the S&P 500 during the fourth quarter of 2018. Neither of these corrections hit the 20% line in the sand required to be called a bear market.
Read More:-White House COVID coordinator warns winter surges of infections will be new normal
Excluding the existing bear market, here’s how many calendar days the previous 10 bear markets took to reach their respective trough, as well as the magnitude of each decline:
- 1957: 99 calendar days, 21% decline
- 1962: 174 calendar days, 26% decline
- 1966: 240 calendar days, 22% decline
- 1968-1970: 543 calendar days, 36% decline
- 1973-1974: 630 calendar days, 48% decline
- 1980-1982: 622 calendar days, 27% decline
- 1987: 101 calendar days, 34% decline
- 2000-2002: 929 calendar days, 49% decline
- 2007-2009: 517 calendar days, 57% decline
- 2020: 33 calendar days, 34% decline
The first thing to note, courtesy of data provided by sell-side consultancy firm Yardeni Research, is that the length of a bear market has no bearing on the magnitude of the decline. Just because the existing bear market has been going on for a while doesn’t necessarily mean the peak decline will be larger than other corrections.
Read More:-Biden gets pushback over TSA airport face scanners
The other key data point here is that we’ve spent 3,888 aggregate calendar days in a bear market since the beginning of 1950. That means the average bear market has lasted approximately 389 days (a little shy of 13 months) over a span of more than seven decades. If this average were to hold up, the current bear market would find its bottom within the next few weeks.
Federal Reserve monetary policy suggests a bear market bottom is a long way off
However, there’s another historic set of data points that bodes poorly for the S&P 500, Dow Jones, or Nasdaq Composite.
Looking back multiple decades, U.S. economic weakness and commensurate stock market corrections have been met with relatively swift action by the Federal Reserve. The nation’s central bank has a history of shifting to a dovish monetary stance during big declines in the broader market. In easy-to-understand terms, the Fed lowers interest rates to encourage lending when the U.S. economy and/or stock market begin to show cracks in their respective foundations.
Read More:-2,000-Year-Old Cemetery in Siberia Leads Archaeologists to Discover New Culture
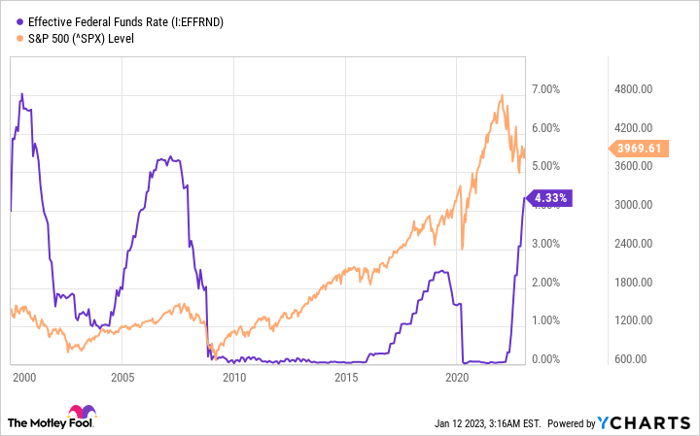
Since this century began, the Federal Reserve has undertaken three rate-easing cycles.
- Jan. 3, 2001: In under a year, the nation’s central bank lowered its federal funds rate from 6.5% to 1.75%. The S&P 500 took 645 calendar days to bottom following this first rate cut.
- Sept. 18, 2007: During the financial crisis, the Fed rapidly cut its federal funds rate from 5.25% to between 0% and 0.25%. The S&P 500 would bottom out in March 2009 after 538 calendar days.
- July 31, 2019: The most recent easing cycle this century saw the Fed reduce its federal funds rate from between 2% and 2.25% to 0% and 0.25%. The S&P 500 bottomed out in March 2020 (during the COVID-19 crash) after 236 calendar days.
On average, it’s taken 473 calendar days for the S&P 500 to reach its bottom once the nation’s central bank begins easing. If the current bear market were to follow previous cycles, a bottom would be expected within the next four months.
Read More:-‘The evidence is powerful’: Trump’s political future could be on the line following judge’s ruling
However, we’re not in a normal bear market or economic cycle. With inflation hitting a four-decade high in June 2022, the Fed has had no choice but to aggressively boost interest rates to tame rising prices. Based on projections from the Fed’s Board of Governors, rate hikes aren’t even in the cards until sometime in 2024.
If it takes an average of 473 calendar days for the S&P 500 to reach its bottom once an easing cycle begins, we could be looking at the longest bear market in history and a nadir that occurs sometime in 2025.
Read More:-Mega Millions ticket sold in Maine wins $1.35-billion jackpot

Putting your money to work during a bear market is a smart move
Regardless of which data set ultimately proves the most accurate, maybe the most important data point of all is the success rate investors have when buying and holding high-quality businesses over long periods.
Every year, market analytics company Crestmont Research releases a report that examines the rolling 20-year total returns, including dividends, of the S&P 500 since the beginning of 1900. In other words, if an investor were to have, hypothetically, purchased an S&P 500 tracking index and held onto that stake for 20 years, what would the average annual return of that stake have been?
Also Read– Elementary school to install metal detectors where 6-year-old shot Virginia teacher
Crestmont’s data shows that all 103 ending years it examined (1919 through 2021) produced a positive total return. What’s more, just a handful of ending years led to an average annual total return of 5% or less, while greater than 40% of all end years produced an average annual total return of between 10.9% and 17.1%. In short, there’s never been a bad time to put your money to work on Wall Street, as long as you have a long-term mindset.
If you’re looking for something a bit more specific than “buy high-quality stocks,” consider dividend stocks and basic necessity sectors and industries as smart places to put your money to work during a bear market.
Also Read– What is NOTAM? Here’s Why the FAA Grounded Flights
Companies that pay a regular dividend are almost always profitable and time-tested. In many instances, these businesses have navigated their way through challenging economic times and understand how to maintain profitability during these generally short-lived contractions.
To add, dividend stocks have historically outperformed companies that don’t offer a dividend. According to a report issued in 2013 by J.P. Morgan Asset Management, a division of banking giant JPMorgan Chase, companies that initiated and grew their payouts between 1972 and 2012 averaged an annual return of 9.5% over this four-decade stretch. By comparison, the non-paying stocks delivered meager annualized gains of just 1.6% over the same period.
Also Read- TK Maxx denies Prince Harry’s claim about shopping retailer’s annual sales
As for basic necessity sectors, consider utilities, consumer staples, and healthcare stocks as potentially intriguing investments to ride out the storm. For instance, no matter how long the bear market endures, people won’t stop getting sick or requiring prescription drugs, medical devices, and healthcare services. This can make established healthcare stocks genius buys during a bear market.
10 stocks we like better than Walmart
When our award-winning analyst team has an investing tip, it can pay to listen. After all, the newsletter they have run for over a decade, Motley Fool Stock Advisor, has tripled the market.*
Also Read– Meghan Markle’s Tailor Breaks Silence On Infamous Kate Middleton Bridesmaid Dress Fiasco
They just revealed what they believe are the ten best stocks for investors to buy right now… and Walmart wasn’t one of them! That’s right — they think these 10 stocks are even better buys.